Have you ever been on a hike and wondered how many feet you have walked up or downhill through the day? I certainly have, and by knowing how to use the 3D analyst toolbar in ArcMAP, I can create an elevation profile for a hike, as long as the necessary data is available.
Below, the image show a High Resolution Orthoimage with a Digital Elevation Model layered on top to create a pseudo 3D map of the Mount Diablo area in California.
Below, the image show a High Resolution Orthoimage with a Digital Elevation Model layered on top to create a pseudo 3D map of the Mount Diablo area in California.
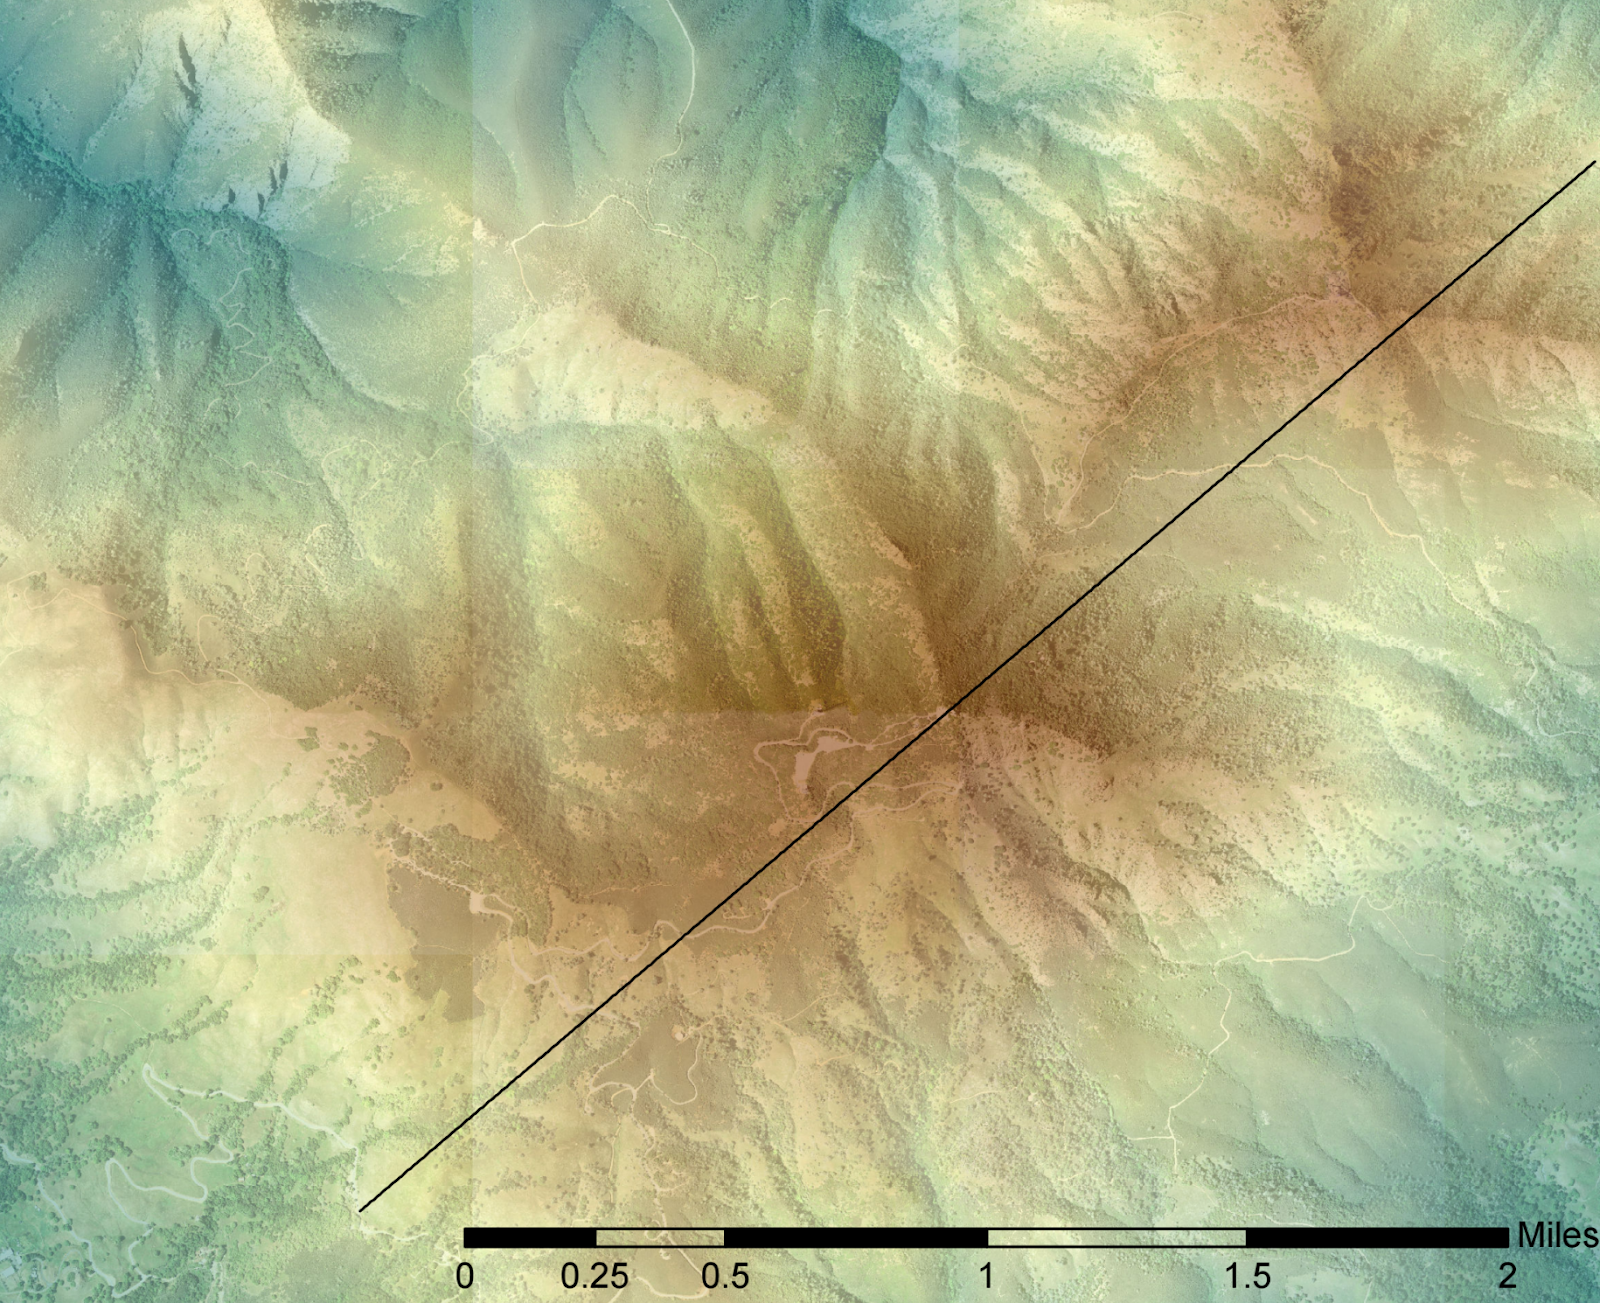
In the image below you can see the elevation graph that corresponds to the line in the image above. The graph starts with the starting point in the lower end of the line.
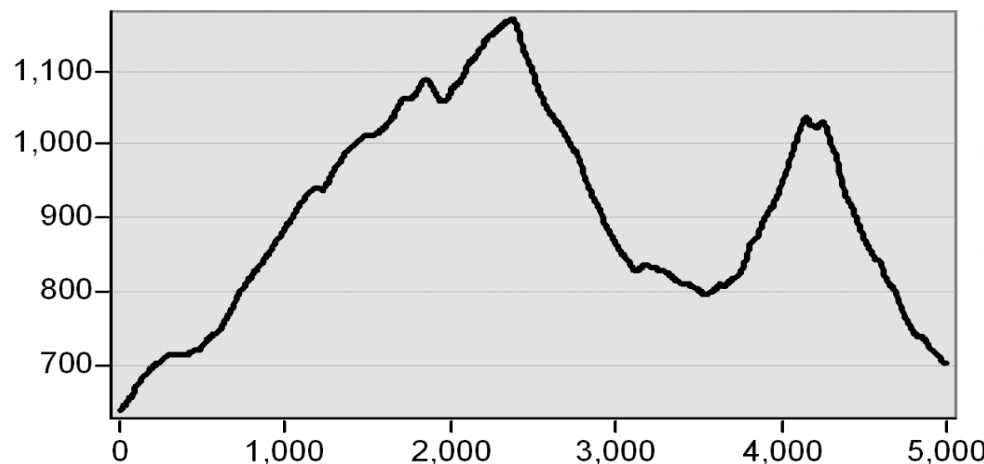
This graph was created by using the “Interpolate Line” tool in the 3D Analyst toolbar. This tool can be used on raster, triangulated irregular network (TIN), or terrain datasets. A line can be drawn directly on the map, as the example above, or over a series of points. Then I used the Profile Graph tool to generate the graphic representation of the line.
Sources: